
Blog
The Cleveland Crime Rate, Explained for Renters and Movers (2026): What the Numbers Really Say
By Utility Search Marketplace · Updated June 9, 2026
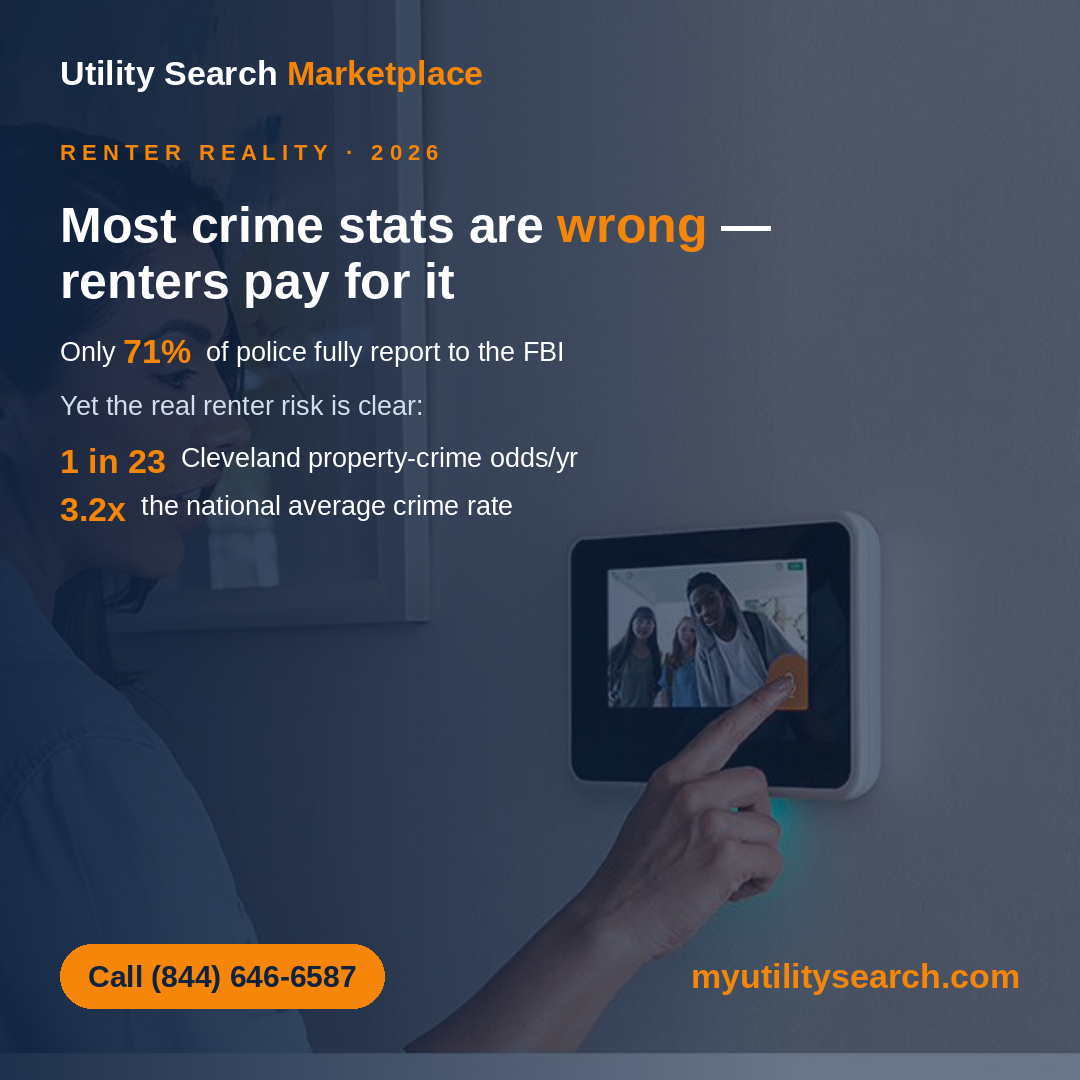
Quick answer: The Cleveland crime rate is high — roughly 3.2x the U.S. average and worse than about 99% of U.S. cities — but the official year-to-year numbers are less reliable than they look, because only ~71% of U.S. police agencies fully report to the FBI and crime definitions have changed over time. For a renter, the figure that matters most is property crime: a Cleveland resident has about a 1-in-23 annual chance of being a property-crime victim, and the city ranks among the nation’s worst for vehicle theft. Compare your address, know your block, and protect your own unit.
If you are moving to or renting in Cleveland, the Cleveland crime rate is one of the first things you will look up — and one of the easiest to misread. The headline numbers are alarming, the year-over-year changes are everywhere in the news, and almost none of it is presented with the context you actually need to make a decision about where to live and how to protect your home. This guide gives you the real picture: what the data says, why parts of it are shakier than they appear, and what a renter should actually do with it.
What is the Cleveland crime rate in 2026?
Cleveland’s overall crime rate sits around 3.2 times the national average, placing it higher than roughly 99% of U.S. cities on the commonly cited crime indices. Broken into the two categories that matter: the violent crime rate runs well above the national average, and the property crime rate is more than double it. In plain odds, a Cleveland resident faces roughly a 1-in-23 chance of property-crime victimization in a given year and about a 1-in-64 chance for violent crime. Cleveland also ranks among the worst cities in the country for motor vehicle theft specifically — the single most renter-relevant number in the dataset.
| Risk category | Annual odds for a Cleveland resident |
|---|---|
| Property crime | ~1 in 23 |
| Violent crime | ~1 in 64 |
| Neighborhood range (varies by area) | ~1 in 47 to 1 in 13 |
Is Cleveland safe? It depends entirely on the block
“Is Cleveland safe” has no single answer, because the citywide average hides enormous variation. Within the city, your odds of being a crime victim range from about 1-in-47 in the southwest to about 1-in-13 in some northern neighborhoods. It is important to read that range correctly: that is not “safe versus unsafe.” Both ends are high by national standards — it is the difference between high risk and very high risk. The practical takeaway for anyone apartment-hunting is that the city-level number is nearly useless for choosing where to live. The block, the street, and the building matter far more than the citywide figure you will see in a headline.
Why crime statistics are less reliable than they look
Here is what most crime articles will not tell you: the official numbers come with serious limitations, and treating a single year’s figure as precise is a mistake. Three reasons to read every crime statistic — including the ones above — with a healthy dose of skepticism:
First, the reporting is incomplete. In 2022, only about 71% of U.S. law enforcement agencies fully submitted their crime data to the FBI. In some cities the gap is dramatic — analysts found cases where the FBI’s published totals missed roughly half the violent crimes a local police department had actually recorded, largely because agencies struggled to migrate to the FBI’s newer reporting system. When data is missing, it gets estimated, so the “official” national number is partly a model, not a raw count.
Second, definitions change. The FBI revised its definition of one major Part 1 offense in 2013 for the first time in its 80-year history, broadening what counts. That means long-run “crime is up/down since [year]” comparisons that cross a definition change are partly measuring the rule change, not real-world change.
Third, short-window comparisons mislead. A city touting a single-year drop is often measuring against an unusually high recent baseline. A 9% one-year dip off a rate that is still triple the national average tells a renter almost nothing about their actual safety. The honest long view, from adjusted FBI data, is that U.S. property crime is down roughly 60% from its early-1990s peak — but vehicle theft has risen over the last five years, which is exactly the category that touches renters most.
What does this mean when you’re shopping for a place?
Being a mindful renter means using the data for what it is good for and ignoring what it is not. Use crime statistics to compare neighborhoods and narrow your search, not as a precise safety score. When you are evaluating an apartment, a few practical moves matter more than the citywide headline:
Check the specific neighborhood and street, not the city average. Ask the landlord directly about package theft, parking and vehicle break-ins, and any prior incidents in the building. Look at whether the building’s security actually covers your unit — because in almost every case, it does not. A lobby camera and a front-desk guard protect the common areas; your door, your windows, and the package on your step are your responsibility. That gap is the single most overlooked fact in apartment security.
What should a renter actually do about it?
You cannot change the Cleveland crime rate, but you can cover your own unit without overpaying or signing a long contract. Renter-friendly security in 2026 is portable and flexible: wireless systems with adhesive sensors start around $200, self-monitoring is often free, and professional monitoring runs under $30 a month with no contract — and some renters-insurance policies offer a 5 to 10 percent discount for a monitored system. The point is to match protection to your real, measurable risk, not to panic-buy a fortress.
You can compare renter-friendly home security options side by side in about five minutes on our security page — it is 100% free to you, because providers pay us, never you, and we never ask for your Social Security number. Prefer to talk it through? Call (844) 646-6587. And since a move usually means setting up everything at once, it is the natural moment to compare internet providers for your new address and, in a deregulated electricity state, to compare energy plans so your whole utility stack starts off right. For the room-by-room playbook, see our companion guide on home security for renters.
Sources
National crime trends and methodology are documented by the FBI Uniform Crime Reporting Program, with long-run analysis from Our World in Data. City-level figures reflect FBI-sourced data aggregated by independent crime-data analysts for the 2024 reporting year.
Frequently asked questions
What is the Cleveland crime rate?
Cleveland’s overall crime rate is roughly 3.2 times the U.S. average, higher than about 99% of U.S. cities. A resident has about a 1-in-23 annual chance of property-crime victimization and a 1-in-64 chance for violent crime, with the city ranking among the worst nationally for vehicle theft.
Is Cleveland safe for renters?
It depends heavily on the neighborhood. Crime risk ranges from about 1-in-47 in the southwest to 1-in-13 in some northern areas — but both ends are high by national standards. The citywide average is a poor guide; the specific block and building matter far more.
Are crime statistics reliable?
Only partially. In 2022 just ~71% of U.S. police agencies fully reported to the FBI, missing data is estimated, and definitions have changed over time. Use crime stats to compare neighborhoods, not as a precise safety score, and weight recent property-crime and vehicle-theft trends most.
Is crime in Cleveland going up or down?
Nationally, property crime is down about 60% from its 1990s peak, though vehicle theft has risen in the last five years. City year-to-year figures are unreliable due to reporting gaps, so a single year’s change tells you little — the standing level of risk matters more than the direction.
How can renters protect against property crime in Cleveland?
Cover your own unit, since building security rarely does. A portable wireless system starts around $200, self-monitoring is often free, and professional monitoring is under $30/month with no contract. Compare options free at Utility Search Marketplace, no SSN required, or call (844) 646-6587.