Blog
The Great Squeeze: Six Years of Flat Real Pay Meet a Doubled Cost of Staying Housed


Updated on November 11, 2026
14 min read
By Chris Burg, founder of MyUtilitySearch · Last updated November 10, 2026
Wages vs inflation since 2020 comes out flat to slightly negative: average hourly earnings are up 28.8% against consumer prices up 29.7% (September 2020 to October 2026), and real median weekly earnings are about where they were in early 2020. Pay has stagnated while the monthly payment on a typical new home roughly doubled, card APRs reached 21%, and the saving rate fell from 6.8% to 3.8%.
Key takeaways: wages vs inflation, 2026
- Pay vs prices: earnings +28.8% against CPI +29.7% since September 2020, so real pay is about 0.9% lower. Real median weekly earnings were $370 in Q3 2026 versus $367 in Q1 2020 (1982-84 dollars): six years of flat real pay. Over the past 12 months, earnings rose 3.2% against 3.7% inflation.
- Housing: principal and interest on a typical new home went from $1,057 to $2,131 a month (+102%).
- Cushion: consumer sentiment 99.8 to 48.1; saving rate 6.8% to 3.8%; card APR 14.58% to 21.19%; bank card loans up 46%.
- Energy: electricity is up about 43% per kWh since 2020 (13.15¢ to 18.83¢) and about 30% in Texas since 2020, and regular gasoline has doubled from $2.19 (Sep 2020) to $4.48 (Sep 2026). Since 2021 it has averaged 45% (2021-2025) to 66% (2026 so far) above its 2016-2020 baseline.
- Jobs: Charter and Comcast announced billions in cost programs but have not disclosed headcount. October payrolls rose 165,000.
- Outlook: forecasters expect slow growth in 2027, with recession odds of roughly 21% to 25%.
How big is the squeeze? The wages vs inflation scorecard
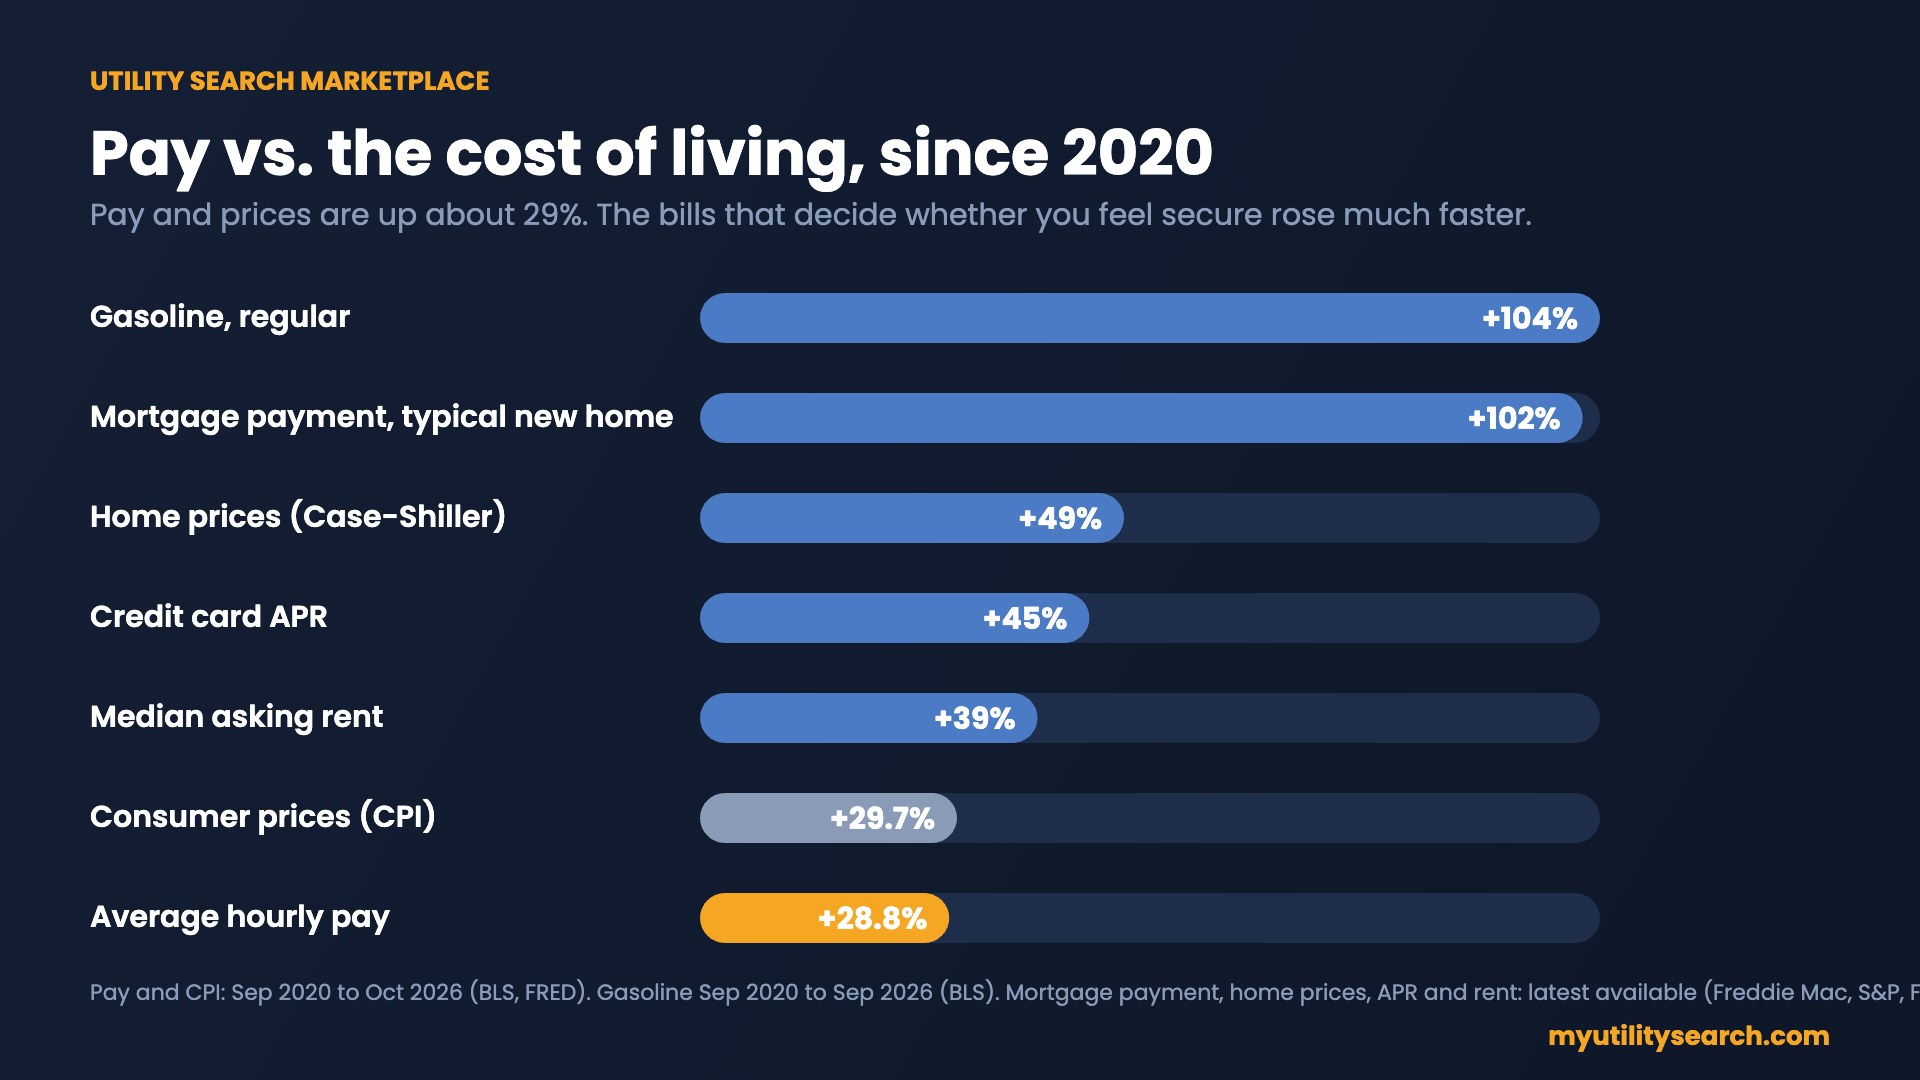
The wages vs inflation story only makes sense next to the bills households actually carry. This scorecard compares 2020 with the latest reading for each.
| Measure | 2020 | Latest | Change |
|---|---|---|---|
| Average hourly earnings (Sep 2020 to Oct 2026) | 100 (Sep 2020 = base) | 128.8 (Oct 2026) | +28.8% |
| Consumer prices, CPI (same period) | 100 (Sep 2020 = base) | 129.7 (Oct 2026) | +29.7% |
| Real median weekly earnings, full-time (1982-84 dollars) | $367 (Q1 2020) | $370 (Q3 2026) | +0.8% |
| 30-year mortgage rate | 2.65% (Jan 2021 record low) | 7.18% | 2.7x |
| Principal and interest, median new home, 20% down ($327,800 in 2020; $393,300 now) | $1,057 | $2,131 | +102% |
| Case-Shiller national home price index | 100 (Sep 2020 = base) | 149 (Sep 2026) | +49% |
| Median asking rent (Zillow) | Base | $1,932 | +39% |
| Personal saving rate | 6.8% | 3.8% | -3.0 pts |
| Consumer sentiment (University of Michigan index) | 99.8 (Jan 2020) | 48.1 (Sep 2026) | -52% |
| Average credit card APR | 14.58% | 21.19% | +45% |
| Bank credit card loans | $754B | $1.1T | +46% |
| Electricity price per kWh, residential (2020 average to Apr 2026) | 13.15¢ | 18.83¢ | +43% |
| Ground beef per lb (Sep 2020 to Sep 2026) | $4.08 | $6.79 | +66.6% |
| Gasoline per gallon, regular (Sep 2020 to Sep 2026) | $2.19 | $4.48 | +104% |
Gold boxed = moved 39% or more since 2020 (up for costs, down for pay cushions and sentiment).
Note: 2.65% is the January 2021 record low, so the mortgage comparison is an extreme case. Even at 3.5%, the same loan costs about 34% less per month than at 7.18%.
Has pay kept up with prices? Wages vs inflation since 2020
No. Real pay has stagnated. Average hourly earnings rose 28.8% from September 2020 to October 2026, while CPI rose 29.7%, so real pay is about 0.9% lower (about 2.3% higher if you start from January 2020). The median full-time worker looks no better: real median weekly earnings were $367 in Q1 2020, peaked at $384 in Q3 2020 when low-wage job losses lifted the median, and were $370 in Q3 2026, which is 3.6% below that peak and 0.8% above early 2020. Since September 2022, average earnings are up 16.2% against 13.5% for prices, a modest recovery after the 2021-22 inflation surge.
Real median household income reached $87,460 in 2025, up from $81,460 in 2022, though that household figure is higher than the individual pay series above. The latest 12 months are tighter: earnings rose 3.2% while CPI rose 3.7%, so wages vs inflation turned slightly negative again. Payrolls grew 165,000 in October with unemployment at 4.1%, but the typical jobless spell is 11.9 weeks and forecasters expect only about 75,000 jobs a month in 2027.
Bottom line: on wages vs inflation, real pay has gone nowhere in six years. It has not collapsed, but it has not grown, while the costs that matter most rose much faster.
Why can’t more people buy a home?
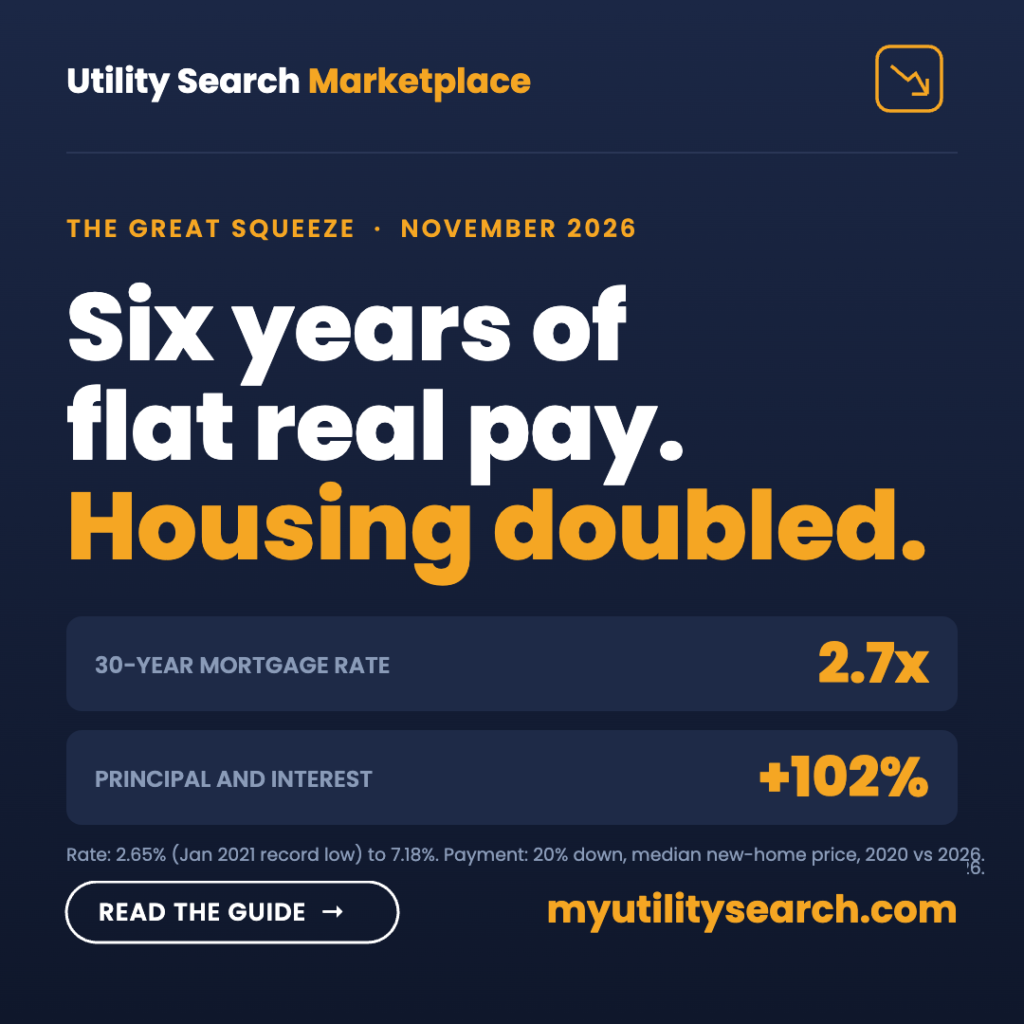
The monthly payment roughly doubled. National home prices are up about 49% since September 2020 (59% from January 2020), and the 30-year mortgage rate went from 2.65% to 7.18%. The median new-home price is $393,300 (+20%), which lifts principal and interest from $1,057 to $2,131 with 20% down. How we got those numbers: the $1,057 is a 20%-down loan of about $262,200 (80% of the roughly $327,800 median new-home price in 2020, implied by the +20% rise) at 2.65% over 30 years. The $2,131 is a $314,640 loan (80% of $393,300) at 7.18%. The 2.7x rate increase on its own multiplies the payment by 1.68, and the 20% higher price multiplies it by 1.20, so 1.68 x 1.20 = 2.02, or +102%. Zillow’s typical payment is $2,004, up 12.8%, because existing-home prices rose less than new-home prices.
Buyers are feeling it. First-time buyers made up 21% of purchases in the NAR 2026 generational report. Renting is no relief: median asking rent is $1,932 (+39%), and Harvard’s Joint Center for Housing Studies finds 49% of renters are cost-burdened.
The national average hides wide local gaps. Of 894 metros in Zillow’s data, the median metro is up 49.9% and only one, Hailey, Idaho, has doubled. Some individual ZIP codes have done far more. That gap is the part of wages vs inflation that a national average hides.
| Local example | What the data shows |
|---|---|
| Dallas metro (Zillow) | Typical-payment and price pressure tracks the national pattern; see Zillow Research for the current ZHVI. |
| Walton County, Florida | A $500,000 home at 7.18% is about $2,710 a month in principal and interest, or 39.7% of the $81,986 county median household income. At 28% of income, a buyer needs about $116,000. |
Are savings and credit absorbing the squeeze?
Yes, in part: households have drawn down savings and leaned harder on credit, and borrowing now costs far more than it did in 2020. The personal saving rate fell from 6.8% to 3.8% (its 2022 low was 2.4%), while bank credit card loans rose from about $754 billion to about $1.1 trillion (+46%). The New York Fed counts $1.263 trillion in card balances and $18.771 trillion in total household debt as of Q2 2026.
Households say they feel it. The University of Michigan consumer sentiment index fell from 99.8 in January 2020 to 48.1 in September 2026, and both June (49.5) and September 2026 sit below the 50.0 reading of June 2022, the previous inflation-shock low. Sentiment is a survey of how people feel, not a measure of spending or hardship, so we treat it as supporting evidence and not proof.
Average card APRs rose from 14.58% to 21.19%, personal-loan rates from 9.26% to 11.90%, and 48-month auto-loan rates from 4.98% to 7.47%. Carrying a $10,000 card balance now costs about $2,119 a year in interest, up from $1,458.
- Delinquency is elevated, not spiking. Bank card delinquency was 2.85% in Q2 2026, versus 3.04% a year earlier and 1.83% in Q2 2022.
- Debt service is flat. It is 11.1% of disposable income, unchanged year over year, because many households hold low fixed-rate mortgages from 2020 and 2021.
- The picture is K-shaped. Estimates differ on how much spending comes from top earners (Moody’s puts it near half; the Dallas Fed’s figure is about 20%).
What this means: on wages vs inflation alone you would miss this, because the squeeze shows up less in defaults today than in thinner buffers. A household that absorbed the last four years with savings and credit has less room if income stops.
What have Charter and Comcast actually announced about jobs?
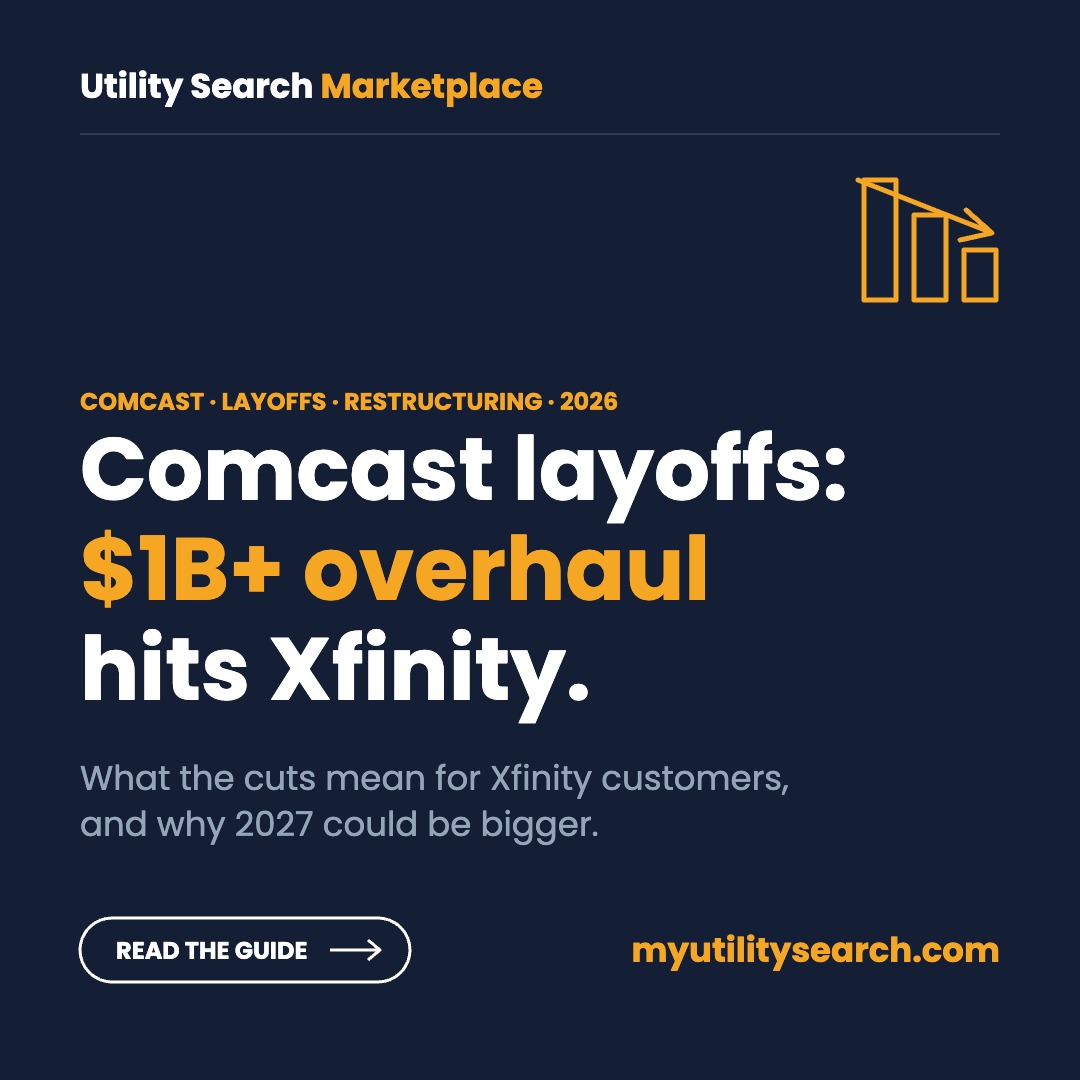
Both have announced large cost programs; neither has disclosed a layoff count. Charter expects about $2 billion in savings over 18 months plus more than $1 billion in synergies from the Cox deal, and its CEO said the effort is not targeted at frontline staff. Comcast announced more than $1 billion in restructuring cost, with no headcount disclosed, against roughly 179,000 employees. See our Charter layoffs tracker and Comcast layoffs tracker for updates.
| Item | Status | Detail |
|---|---|---|
| Charter cost savings | Announced | About $2B over 18 months; no layoff count given |
| Charter-Cox synergies | Announced | More than $1B; no layoff count given |
| Comcast cost program | Announced | More than $1B restructuring cost; a cost, not confirmed savings or headcount |
| Washington 159-job filing | Reported | Local news coverage; primary WARN notice not verified by us |
| Which departments, which states, when | Unknown | No company has published this |
The broader labor market is softer but not collapsing. October payrolls rose 165,000 (September was revised to 60,000), and unemployment is 4.1%. Challenger, Gray & Christmas tracked 43,994 announced cuts in October (down 71% from a year earlier) and 573,195 through September (down 39%), with AI cited for about 21%. Over a decade, telecom 10-K headcount fell 24% to 54% at legacy carriers, while cable looks flat because mergers reset the baseline.
What this means: wages vs inflation gets harder to win if income stops, and the consolidation story is a leading indicator to watch, not yet a measured loss. We will update this section when WARN notices or earnings calls put numbers on it.
How are energy and internet bills moving?
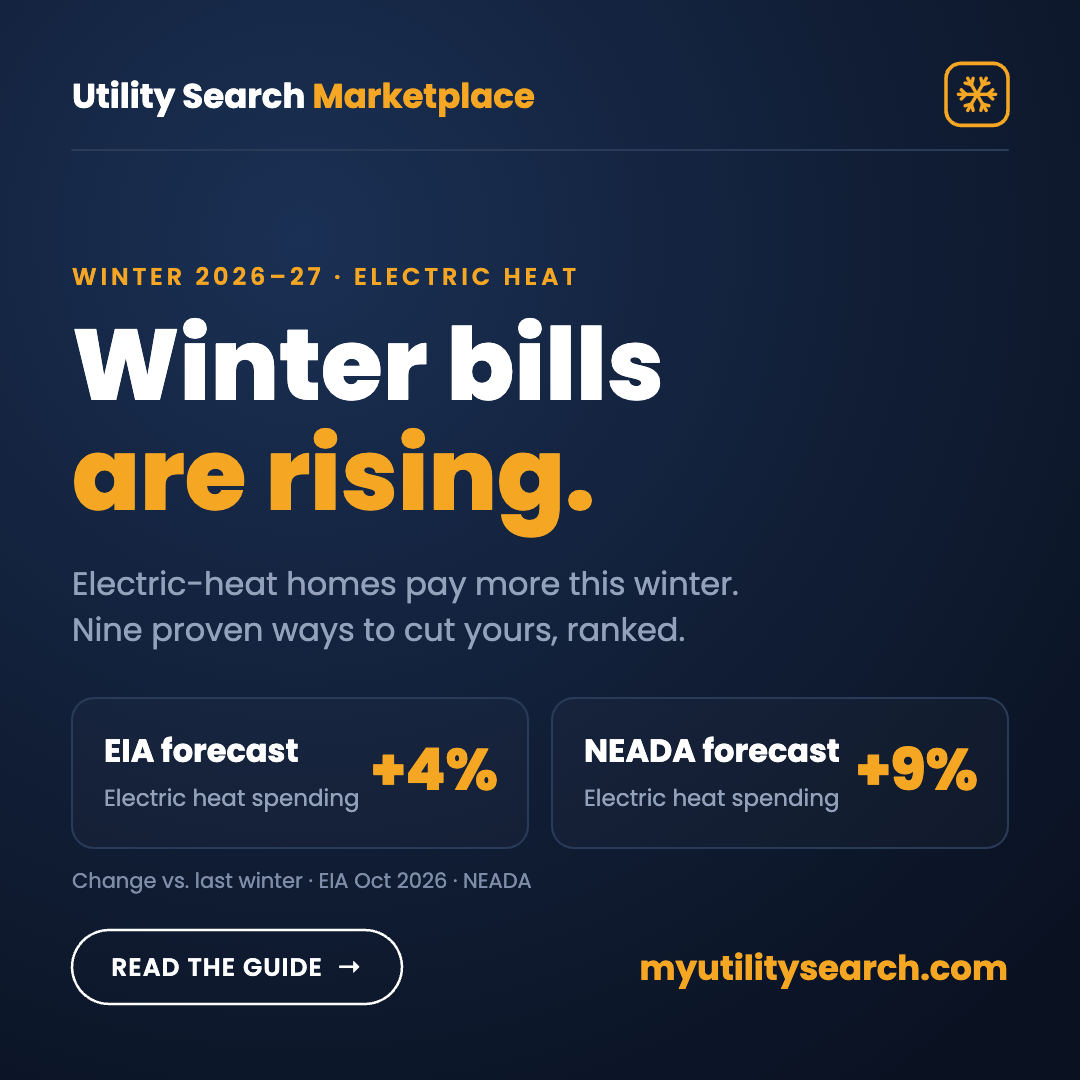
Energy is rising faster than headline inflation. In the October 14, 2026 CPI release, electricity was up 4.4% and utility gas 5.0% year over year, while gasoline was up 34.2%. The average residential electricity price moved from 13.15¢ per kWh in 2020 to 18.83¢ in April 2026 (about +43%, EIA Electric Power Monthly Table 5.3; the 2026 figure is one month, not a full-year average). At the same usage, a $300 monthly bill today would have been about $210 at 2020 rates.. See whether electricity prices are going up where you live.
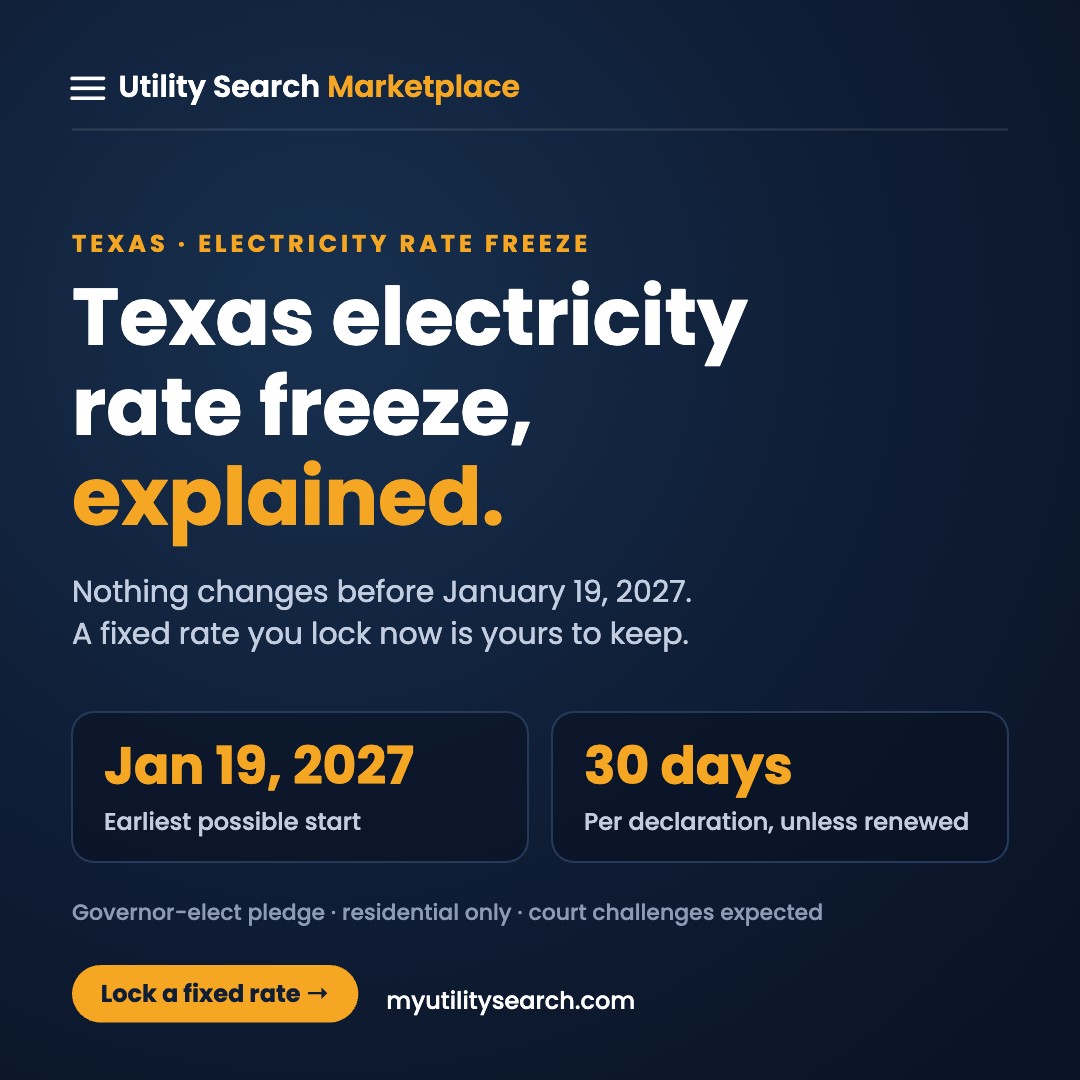
Texas is a useful local case. The Texas Electric Policy Research Institute (reported by KERA) estimates Texas electricity costs are up about 30% since 2020, with transmission and distribution about 39% of bills. More than 3 million disconnections were recorded in 2024, and ERCOT projects demand rising from 87 GW to 145 GW by 2031. In the PJM region, capacity prices rose from $28 to $329.17 per MW-day; ICF’s estimate of 30% to 60% higher bills by 2030 is a projection, not a measured result.
On internet, Charter lost about 233,000 customers in Q3. We have no evidence yet that cost programs change what consumers pay, so we treat any price effect as unproven. For households, energy is the clearest place where wages vs inflation turns against you.
What happened to food and gas prices?
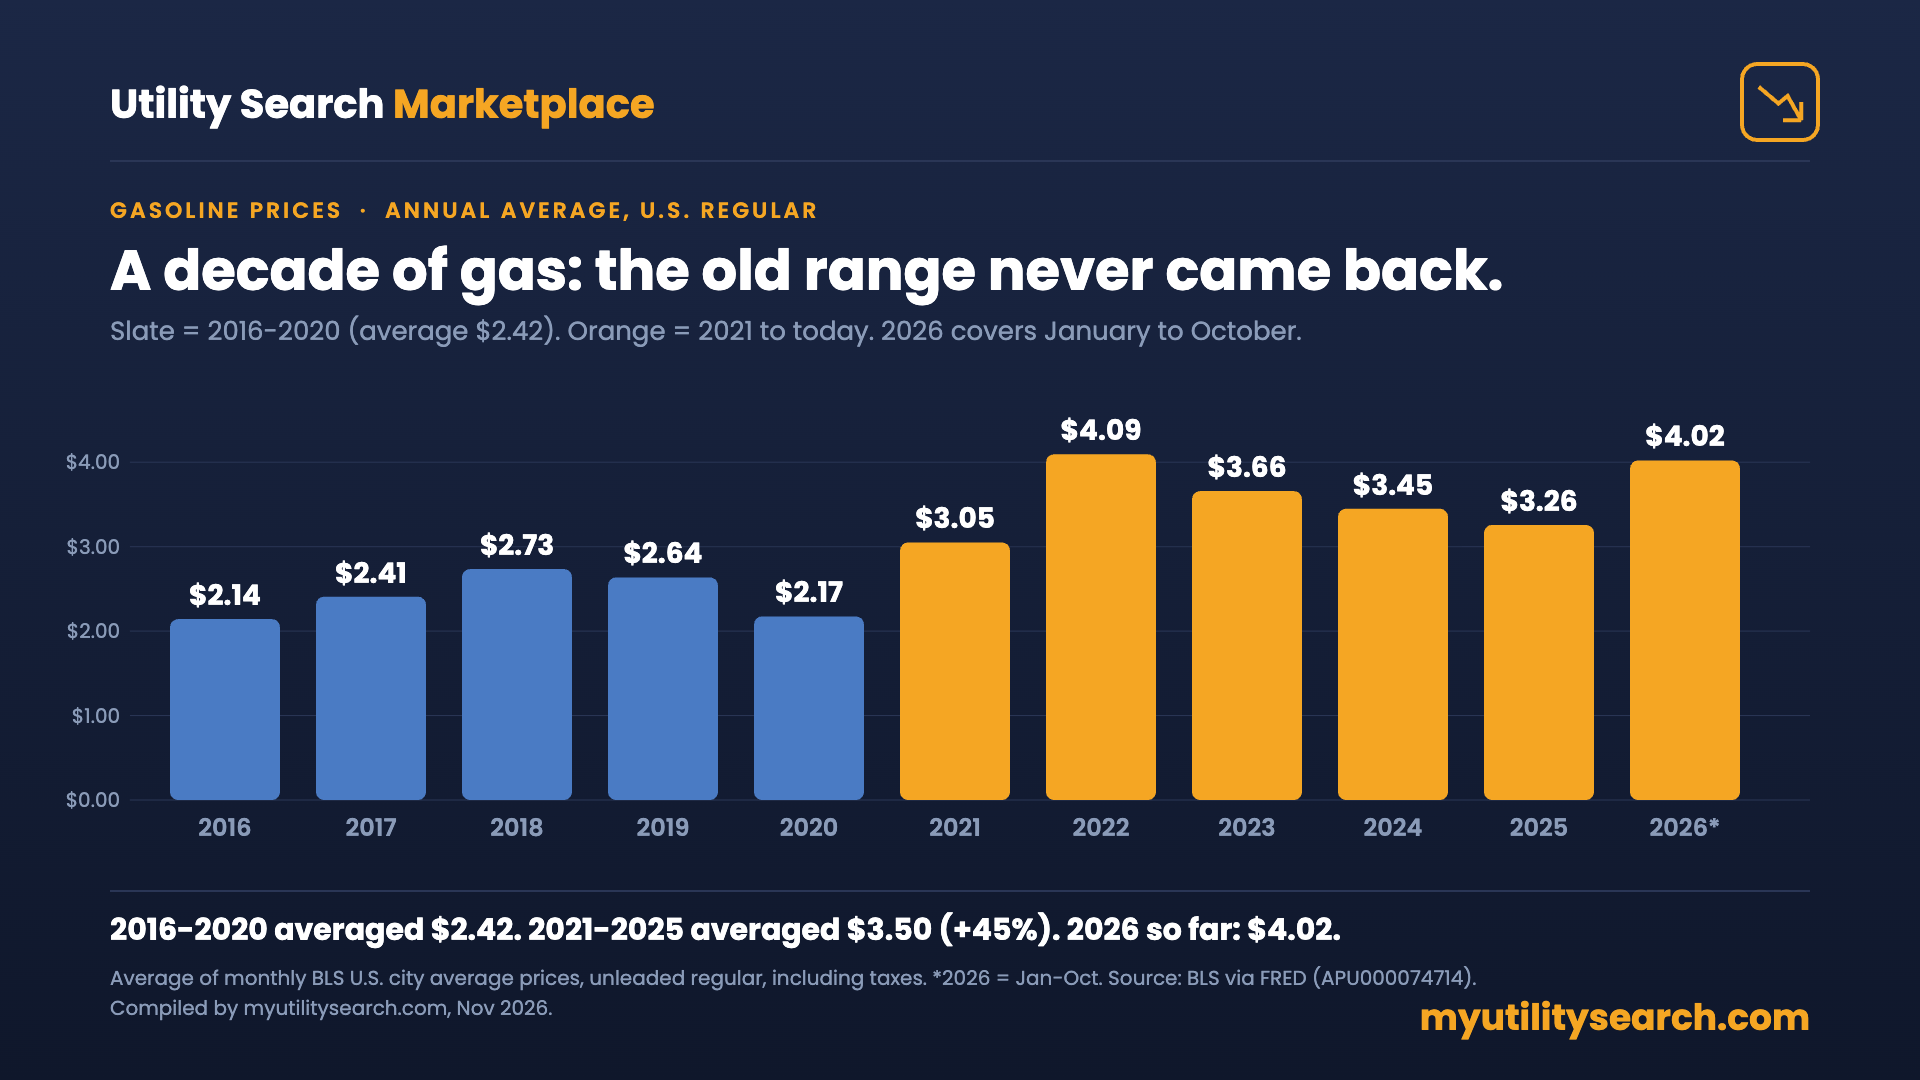
Gasoline is the biggest mover over the full six years: the U.S. regular average went from $2.19 in September 2020 to a $5.06 peak in June 2022 and $4.48 in September 2026 (+104% since 2020). The monthly average was above $4 every month from July to October 2026, and it is up about 35% from $3.31 in June 2025 to $4.45 in October 2026. It has started to ease, with the weekly average at $4.15 on November 2. Prices at individual stations vary widely from these national averages.
The ten-year view tells the story. Gasoline averaged $2.42 a gallon from 2016 to 2020, and no monthly average topped $2.92. From 2021 to 2025 it averaged $3.50, which is 45% above that baseline, and since March 2021 no month has been below $2.79. So far in 2026 it averages $4.02, which is 66% above the 2016-2020 baseline and second only to 2022. Even 2025, the cheapest year since 2021, was 35% above it.
Ground beef is up 66.6% since September 2020 ($4.08 to $6.79). The table below uses September 2022 as the starting point, because that is where our staples basket starts: it rose from $19.47 to $21.55 (+11%) against wage growth of about 16% over the same stretch, so groceries alone are not the squeeze. On staples, wages vs inflation looks roughly even.
| Item | Sep 2022 | Sep 2025 | Sep 2026 | Change since Sep 2022 |
|---|---|---|---|---|
| Ground beef (per lb) | $4.86 | $6.32 | $6.79 | +39.7% |
| Chicken (per lb) | $1.89 | $2.06 | $2.06 | +9.1% |
| Bread (per lb) | $1.75 | $1.87 | $1.83 | +4.6% |
| Milk (per gallon) | $4.18 | $4.13 | $4.11 | -1.7% |
| Eggs (per dozen) | $2.90 | $3.49 | $2.27 | -21.7% |
| Gasoline (per gallon) | $3.88 | $3.34 | $4.48 | +15.5% |
A note on ownership. In November 2016 the World Economic Forum published a short video and an essay by Danish politician Ida Auken, “Welcome to 2030,” imagining a city where a person owns very little and relies on shared services. “You’ll own nothing. And you’ll be happy” became its shorthand (background). It was a scenario for discussion, not a forecast or a policy, and Auken has said it was not her utopia. We raise it because the data points the other way for the typical buyer: the monthly payment to own a new home has doubled.
How do the bills add up?
No single bill explains the squeeze; the stack does. Each line below rose faster than flat real pay, and households pay all of them at once. A new buyer carrying a $10,000 card balance faces about $1,130 more a month than in 2020 from housing and card interest alone, before electricity, food and fuel.
| Bill | 2020 | Latest | Added cost |
|---|---|---|---|
| Housing: principal and interest on a typical new home | $1,057 a month | $2,131 a month | +$1,074 a month |
| Housing: rent (Zillow median asking) | about $1,390 a month | $1,932 a month | about +$540 a month |
| Credit: interest on a $10,000 card balance | $1,458 a year | $2,119 a year | +$661 a year (about $55 a month) |
| Energy: electricity | 13.15¢ per kWh (2020 average) | 18.83¢ per kWh (Apr 2026) | +43% per kWh (a $300 bill today would have been about $210 at 2020 rates, same usage) |
| Food: six-item staples basket | $19.47 (Sep 2022) | $21.55 | +$2.08 per basket (+11%) |
| Fuel: gasoline | $2.19 a gallon (Sep 2020) | $4.48 a gallon (Sep 2026) | +$2.29 a gallon (+104%) |
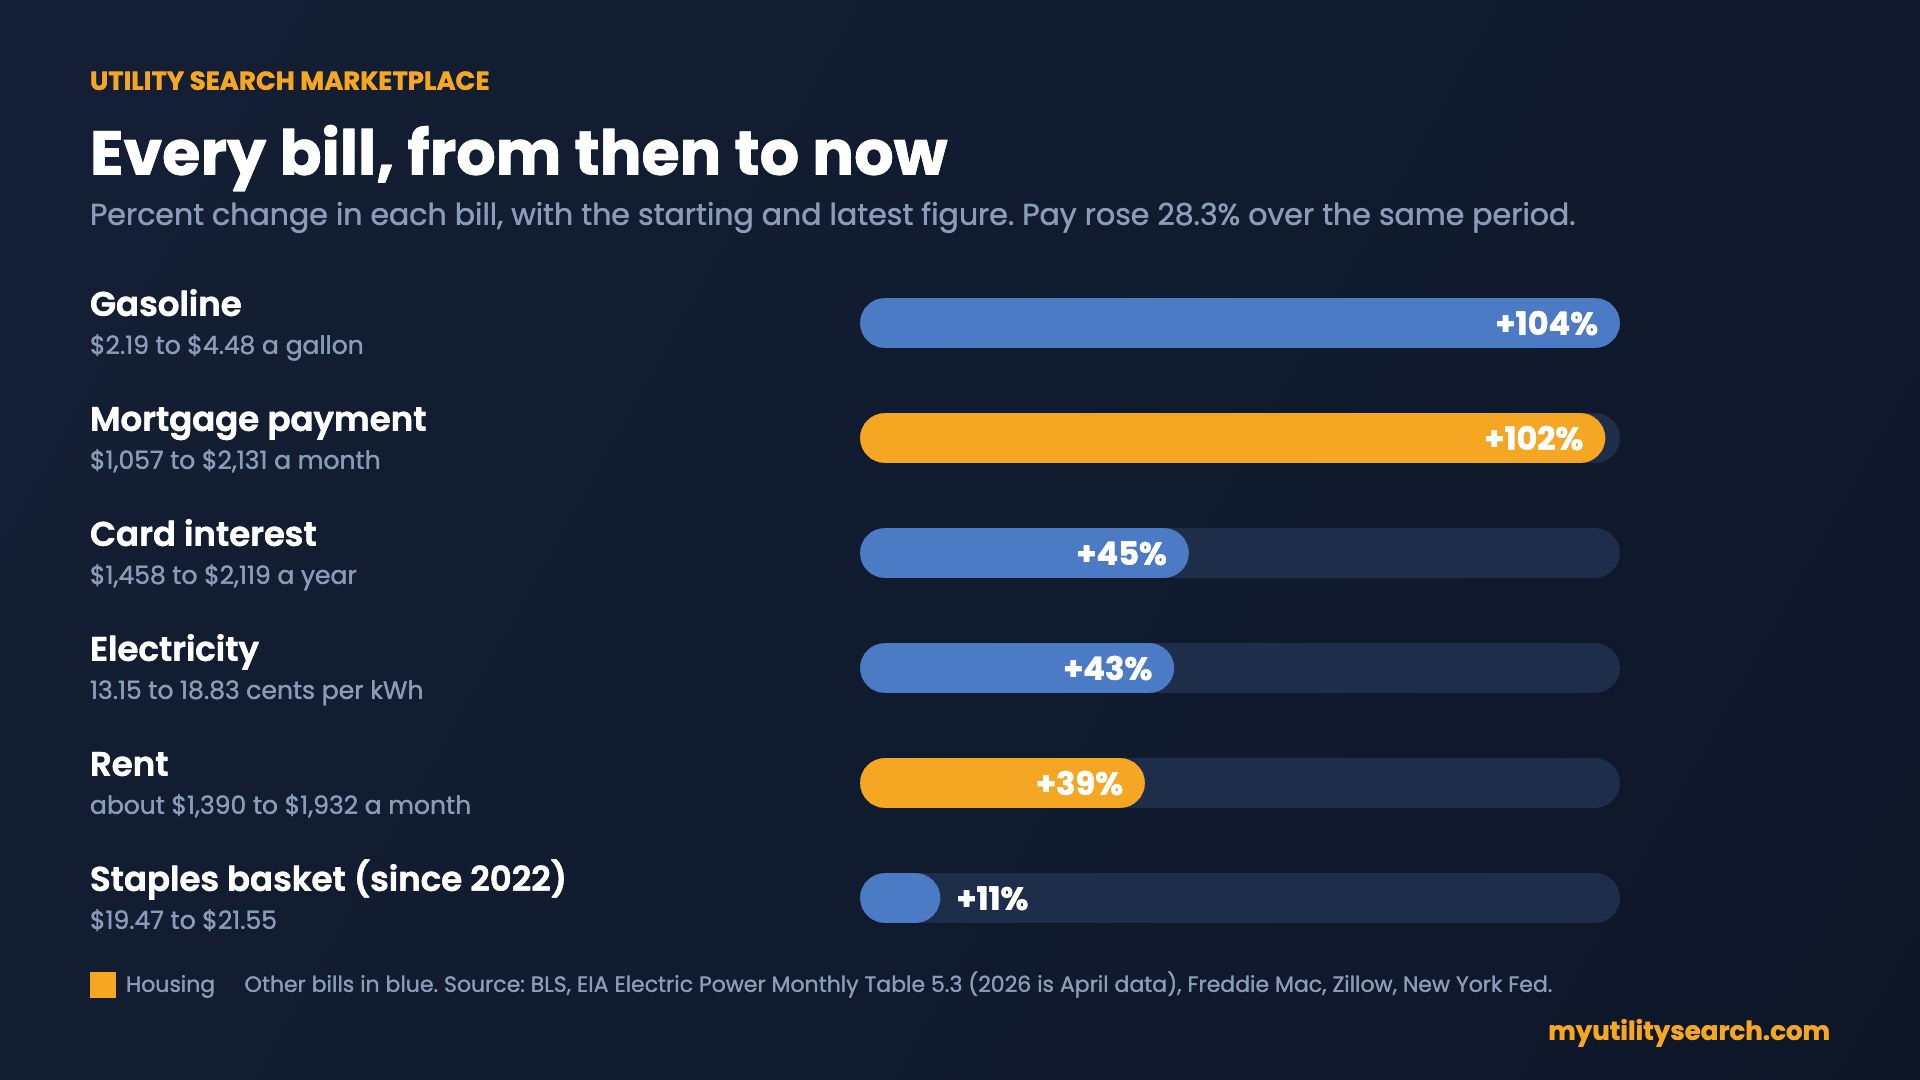
Who feels it: new buyers and renters pay the full housing increase. Existing owners with a fixed-rate mortgage from 2020 or 2021 do not, which is why delinquencies are elevated but not spiking. The rent line is estimated from Zillow’s reported +39% change, and we have not quantified insurance, healthcare or internet costs here.
What could 2027 look like for wages vs inflation?
Forecasters expect slow growth, not a collapse, but the risk is tilted down. The Philadelphia Fed Survey of Professional Forecasters (Q3 2026) projects 2.2% GDP growth, 4.3% unemployment and 2.3% CPI inflation for 2027, with about a 21% chance of a negative quarter. U.S. Bank’s November 2 outlook is more cautious: 2.0% growth, 4.2% unemployment, a 25% recession probability, and Fed hikes to a 4.25% to 4.50% range.
Some forecasts are bleaker: David Rosenberg (March 2026) argued for a significant recession if AI capital spending pulls back. Zillow forecasts home values up about 1% and rents up about 3%, which would not relieve affordability. We could not verify a 2028 forecast, so we are not publishing one.
Watch list: Q4 earnings calls from Charter, Comcast and other telecoms; WARN notices where Charter and Cox overlap; monthly jobs reports; and Optimum debt maturities of $4.1 billion in April 2027 and $2.2 billion in July 2027, per our telecom bankruptcies page.
What can households control when wages vs inflation stalls?
You cannot move mortgage rates or wages, but you can reprice the bills that are shoppable: internet, electricity in deregulated states (see deregulated energy), and home security. Check whether an internet promotion has expired, compare fixed-rate electricity plans against your utility’s price to compare, and pay down card balances at 21% APR first, which beats most savings rates.
Our read: wages vs inflation, methodology and limits
Our read: on wages vs inflation, this is a squeeze, not a collapse. Real pay has been flat for six years, and the largest costs households carry (housing payments, interest, energy) rose faster than pay, while savings fell and credit filled the gap. That leaves less margin for a shock, and the announced telecom cost programs are a reason to watch 2027 labor data closely. Nothing here says mass layoffs have happened; it says the cushion is thinner if they do.
Method: price and wage comparisons use FRED series (CPIAUCNS for the compounding math, CES0500000003 for average earnings, LES1252881600Q for real median weekly earnings), BLS releases, and the New York Fed household debt report. Mortgage payments use payment = loan x r / (1 – (1 + r)^-360), with 20% down.
Limits: the real median earnings series is quarterly and rounded to whole dollars, and Q3 2020 is elevated by pandemic job losses concentrated among low-wage workers; we could not retrieve the production and nonsupervisory wage series; national averages hide local variation; 2.65% is a record low, so the 2020 comparison is an extreme case; Zillow’s payment-to-income shares conflicted (34.7% vs 41.5%), so we cite payment levels; healthcare costs are not covered in this edition; and we could not verify a 2028 outlook or the primary Washington WARN notice.
Wages vs inflation FAQ
Have wages kept up with inflation since 2020?
Not really: real pay has been flat to slightly lower. Average hourly earnings are up 28.8% from September 2020 to October 2026 against CPI up 29.7%, so real pay is about 0.9% lower, and real median weekly earnings are about 0.8% above early 2020. Over the past 12 months, earnings rose 3.2% against inflation of 3.7%.
Why is buying a home so much harder than in 2020, even if wages vs inflation looks even?
The monthly payment roughly doubled. National home prices are up about 49% since September 2020, and the 30-year mortgage rate went from a record-low 2.65% to 7.18%, which lifts the principal-and-interest payment on a typical new home from $1,057 to $2,131.
Are Charter and Comcast laying off workers?
Both have announced large cost programs, but neither has published a layoff count. Charter cites about $2 billion in savings plus more than $1 billion from the Cox deal; Comcast cites more than $1 billion in restructuring cost. We will report headcount when WARN notices or earnings calls provide it.
Will 2027 be a recession, and what does it mean for wages vs inflation?
Most forecasters do not expect one, but the odds are not small, and a recession would hit wages vs inflation through slower hiring. The Philadelphia Fed survey puts the chance of a negative quarter near 21%, and U.S. Bank’s recession probability is 25%.
What can I do about rising bills?
Compare the shoppable ones (internet, electricity in choice states, home security) and pay down high-APR card balances first. Wages vs inflation is outside your control; your bills partly are.
Compare energy, home security & home warranty
Sources
Last updated: November 10, 2026.
- U.S. Energy Information Administration, Electric Power Monthly, Table 5.3: average price of electricity to ultimate customers (residential 13.15 cents per kWh in 2020; 18.83 cents in April 2026, as tabulated by ElectricChoice)
- FRED: Average Hourly Earnings, Total Private (CES0500000003)
- FRED: Real Median Usual Weekly Earnings, Full-Time (LES1252881600Q)
- FRED: University of Michigan Consumer Sentiment (UMCSENT)
- FRED: Average Price, Gasoline, Unleaded Regular (APU000074714)
- FRED: Consumer Price Index, All Urban Consumers (CPIAUCNS)
- FRED: Personal Saving Rate (PSAVERT)
- FRED: Real Median Household Income (MEHOINUSA672N)
- FRED: S&P Case-Shiller U.S. National Home Price Index (CSUSHPINSA)
- FRED: 30-Year Fixed Rate Mortgage Average (MORTGAGE30US)
- FRED: Commercial Bank Credit Card Interest Rate (TERMCBCCALLNS)
- FRED: Credit Card Delinquency Rate (DRCCLACBS)
- FRED: Household Debt Service Payments as a Percent of Disposable Income (TDSP)
- BLS: Consumer Price Index
- New York Fed: Household Debt and Credit Report
- Philadelphia Fed: Survey of Professional Forecasters
- Zillow Research: Data
- Harvard Joint Center for Housing Studies: America’s Rental Housing
- Challenger, Gray & Christmas: Job Cut Reports
- U.S. Bank: Q4 2026 investment outlook
Keep going
- Charter layoffs 2026: what has been announced
- Comcast layoffs 2026: the restructuring explained
- Telecom layoffs by company: what the SEC filings show
- Telecom consolidation tracker: who bought whom
- Deregulated energy: compare electricity plans
- Are electricity prices going up?
- Is it a good time to buy a house?